When my girlfriend came back from Peru she had gathered enough material to work on her master thesis. But there was one thing she was not quite sure how to solve: she had visited several cooperatives shattered all over Peru. And she wanted to include a map in her thesis which would show the exact location of each and every different site. Now one solution would be to just copy an image from Google Maps or Open Street Map and then manually draw a circle over every location visited. Not a very handy solution, and an inaccurate one as well.
Again, R is going to save the day. In fact, as almost everything is already covered by existing packages, our to-do list remains very short:
- Create a data frame containing each and every location expressed by geo data (i.e. longitude and latitude)
- Download a map of Peru from Google Maps with a proper zoom level
- Display every visited location on the downloaded map and plot everything
For all tasks we are going to use primarily the CRAN package ggmap for determining the geo data from a given location and for downloading and plotting a map.
Okay, step 1: load all the visited locations into a data frame:
library(ggmap)
peruLocations <- data.frame()
peruLocations <- rbind(peruLocations, geocode("Piura, Peru"))
peruLocations <- rbind(peruLocations, geocode("Montero, Peru"))
peruLocations <- rbind(peruLocations, geocode("Tingo Maria, Peru"))
peruLocations <- rbind(peruLocations, geocode("Bagua Grande, Peru"))
peruLocations <- rbind(peruLocations, geocode("Lima, Peru"))
peruLocations <- rbind(peruLocations, geocode("Quillabamba, Peru"))
peruLocations <- rbind(peruLocations, geocode("Quellouno, Peru"))
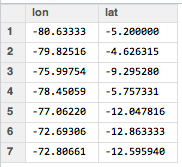
This gives us a neat matrix containing geo codes of every location:
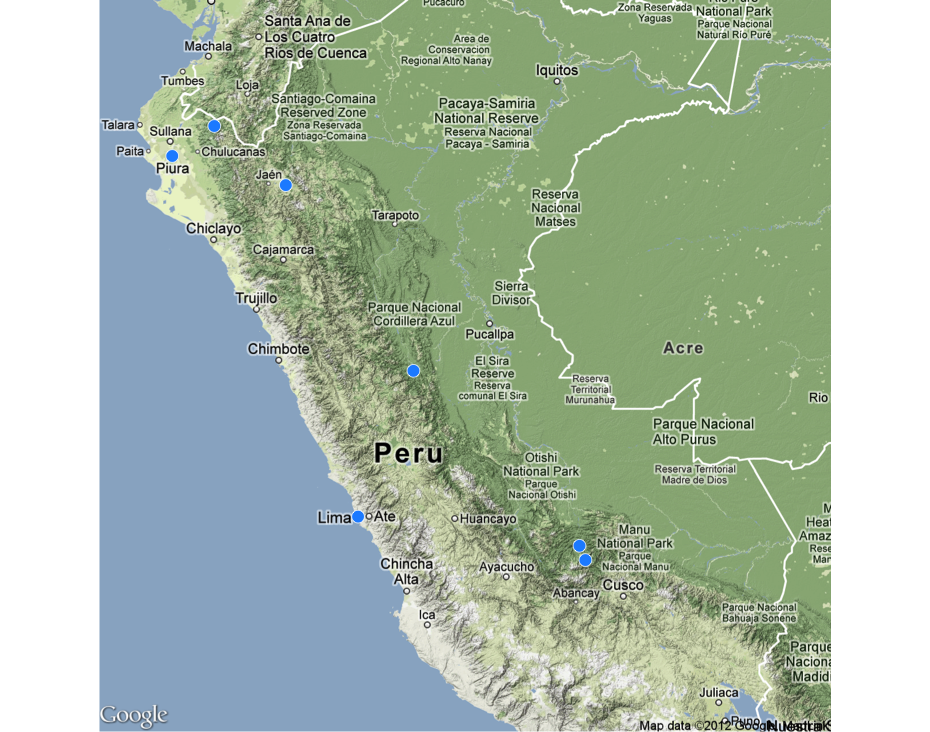
Steps 2 and 3: download the map and display all points from the data frame:
map <- get_map("Peru", zoom=6, color="color", source="google", maptype="terrain")
myMap <- ggmap(map, extent="device", legend="top")
myMap + geom_point(aes(x=as.numeric(lon), y=as.numeric(lat)), col="white", fill="dodgerblue", data=peruLocations, shape=21, size=6)
Finally, this is our output. Now we just need to add some names and proper description to the locations, and we’re ready to go.