When you want to import electronic documents into KTA or KC, the Kofax Import Connector (KIC) is your best option. Sometimes however, KIC will stop importing documents, leaving many customers clueless about what’s happening (or not happening, in that regard). In most cases KIC hasn’t stopped working: there are just too many failed messages that require someone’s attention. This post will show you how you can take preventive action and act before it is too late by monitoring KIC. Should you already use KTA, you’ll also see the zero-code approach really shining here.
To understand KIC’s behavior, it’s important to learn more about the general concepts behind it. Basically, there are only two components: the Message Connector (MC) and the KC Plugin (or KTA itself). The first component is concerned with receiving messages and document conversion – the second component then forwards the converted documents to KC or KTA. The Message Connector uses a temporary file of a fixed size for data storage – when new messages arrive, the oldest ones are automatically removed from that storage to free up space. However: the MC will never remove failed messages. That makes sense, as deleting them would mean losing them forever.
So, this is what I usually think of first when customers call me about a failing import component. And here comes the vicious circle: usually KIC works like a charm, so no one checks for failed messages in the Message Connector Monitor (a monitoring page for the MC that ships with KIC and KTA). If no one takes care of failed messages, they will start using up space. Just a little when you have a few failed ones, but eventually you will end up with a few hundred megabytes of failed messages. At some time, the storage limit will be reached – and instead of deleting messages, KIC will stop working all together.
The desired result
Here’s what I want: whenever a certain limit of failed messages is reached, I want to receive an e-mail that looks as follows:
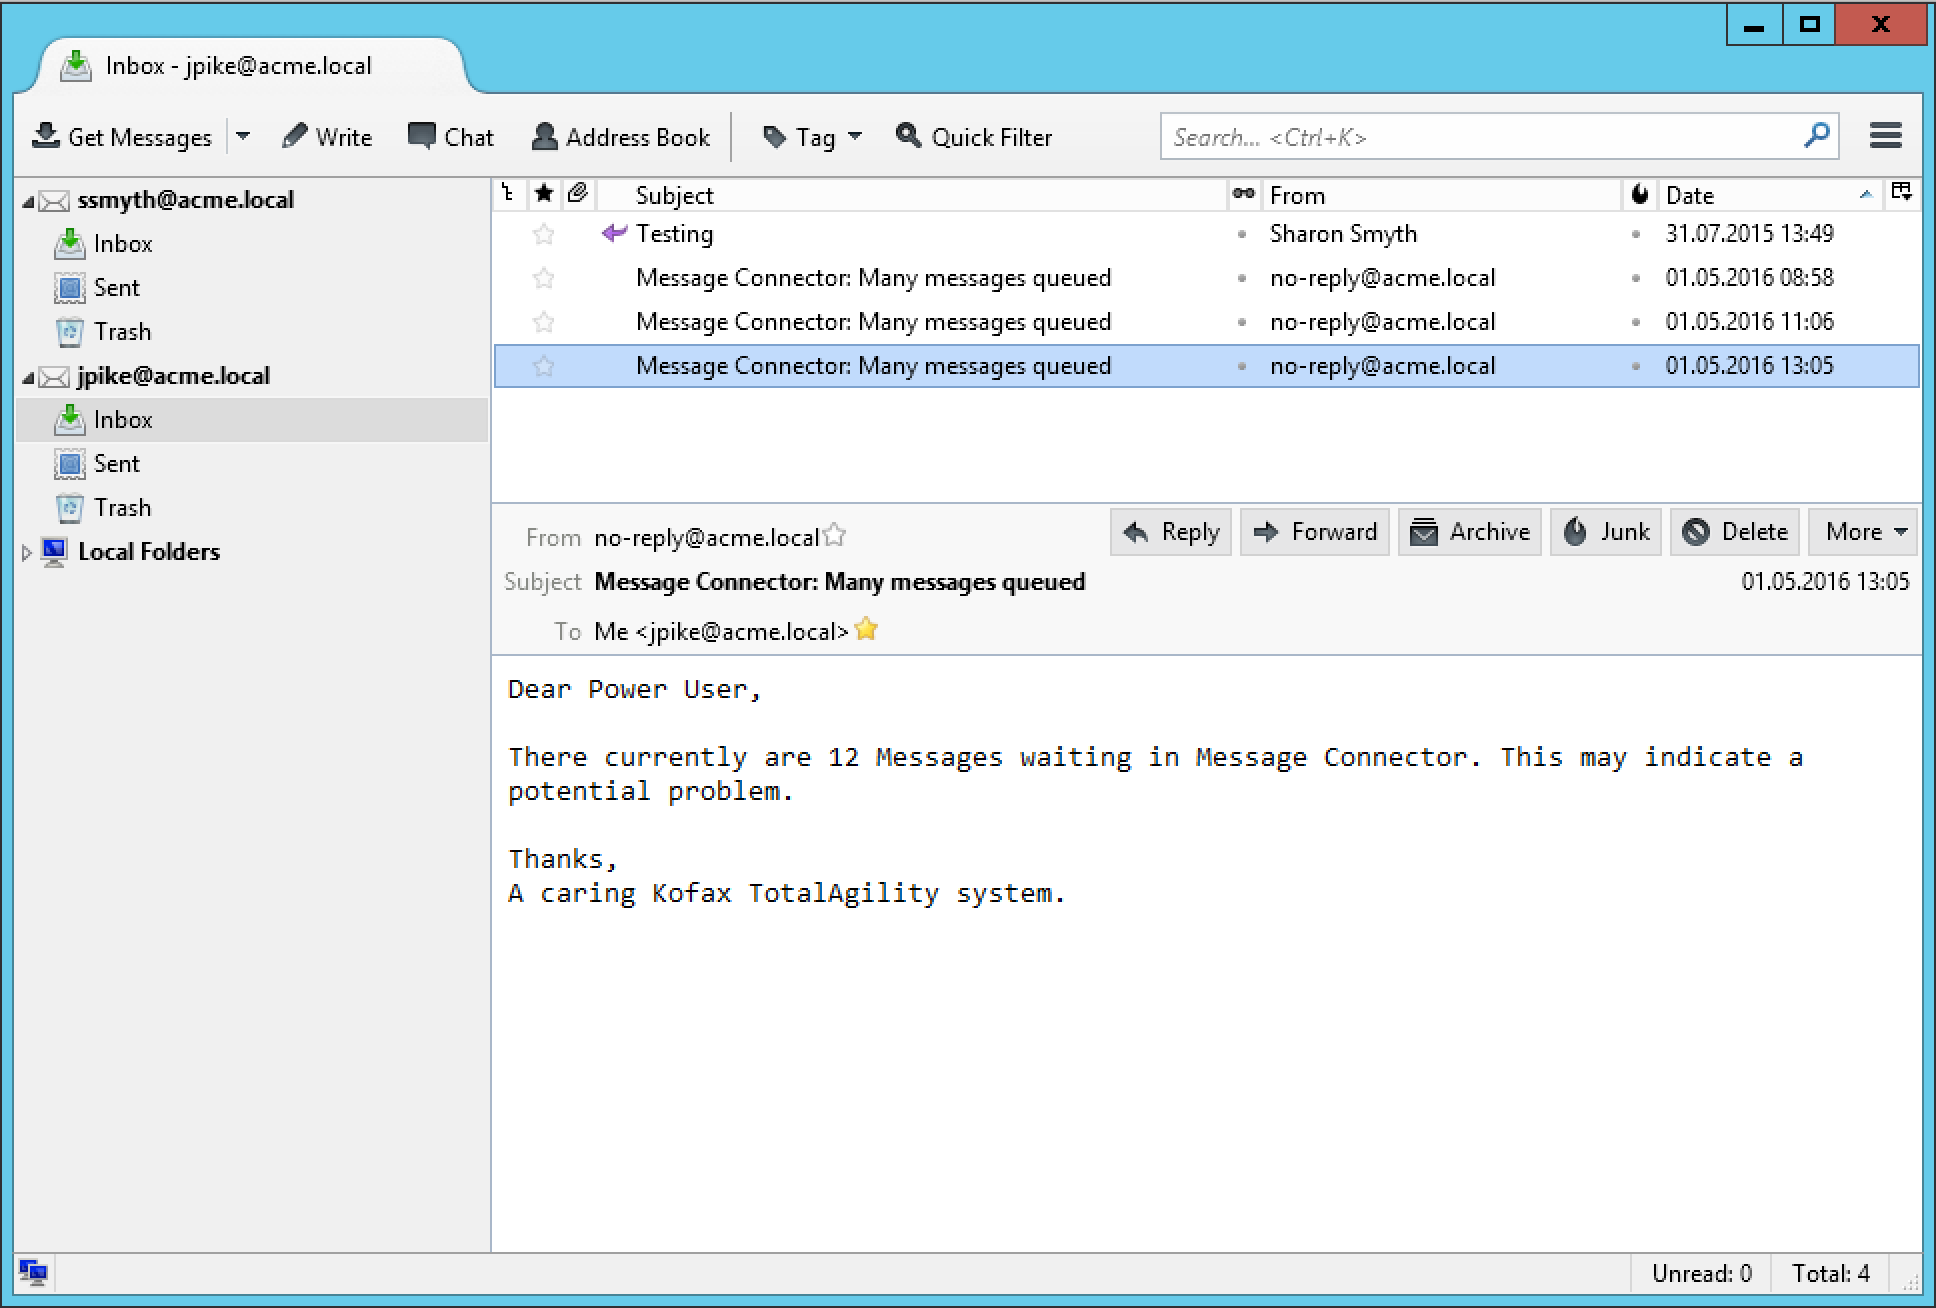
How the Message Connector exposes data
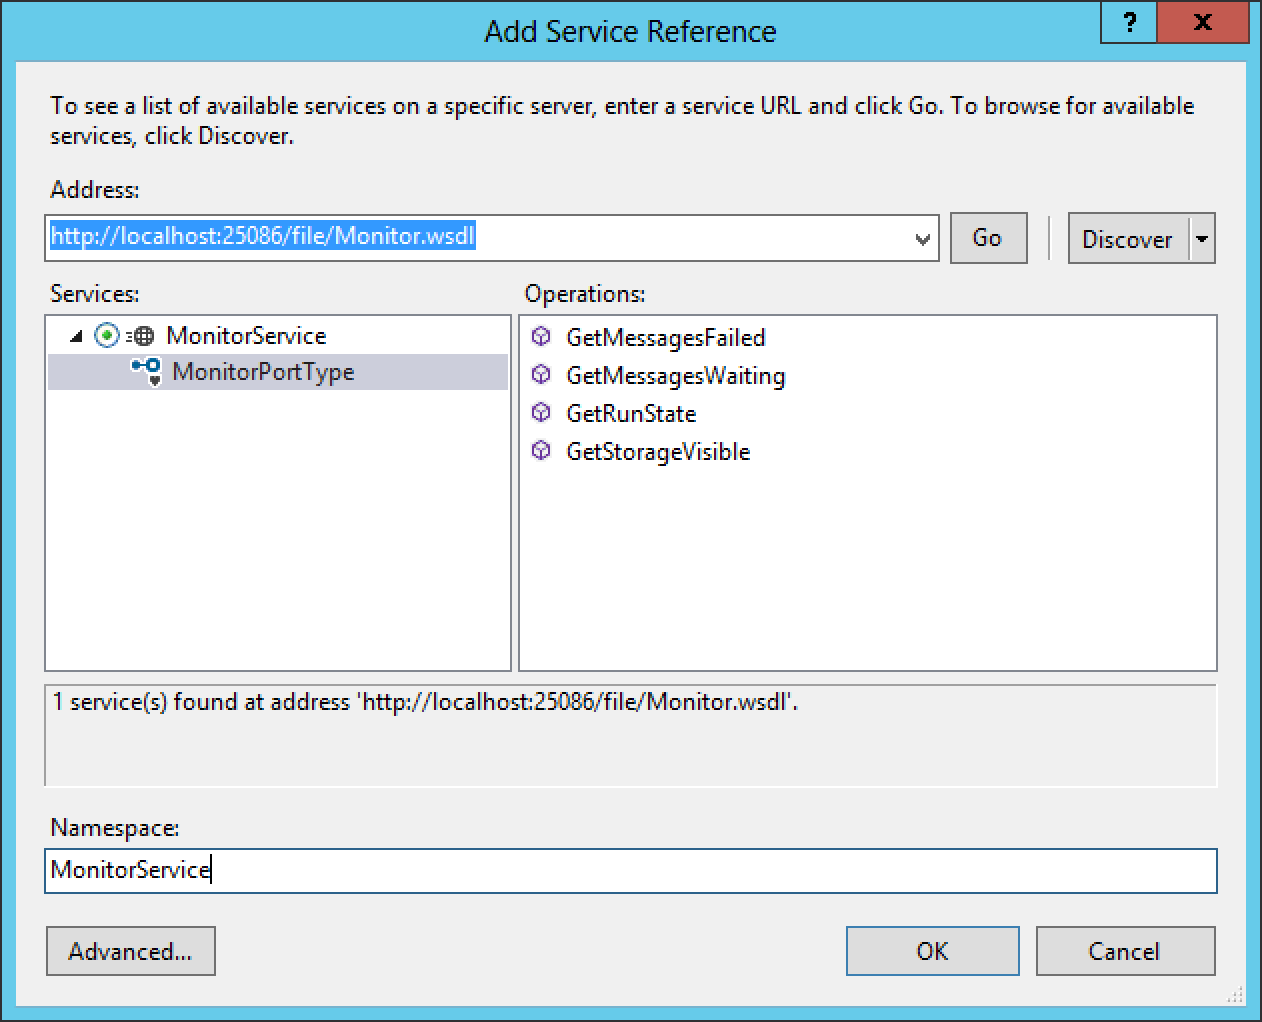
I truly love KIC. While it appears quite simple, there wasn’t any use case I could not solve with a combination of settings an scripts, all within the Kofax subsystem. In a similar manner, monitoring the individual components is easy: thanks to the SOA approach, there’s a web service for anything. The message connector for example exposes a monitoring interface at the following URL (just replace localhost with your host name): http://localhost:25086/file/Monitor.wsdl
While intended to be used in conjunction with a discontinued product called Kofax Monitor, nothing stops us from using exactly that web service. The monitor class exposes the following methods:
- GetRunState: tells you if the Message Connector is running at all, will return one of three possible states: “0” means not running at all; “80” tells us that the storage is full, and “100” informs us MC is running,
- GetStorageVisible: returns the percentage of storage currently used,
- GetMessagesFailed: tells us how many messages have failed and need further attention,
- GetMessagesWaiting: informs us about the number of currently queued messages.
If you’ve ever used the Message Connector Monitor, this all sounds quite familiar:
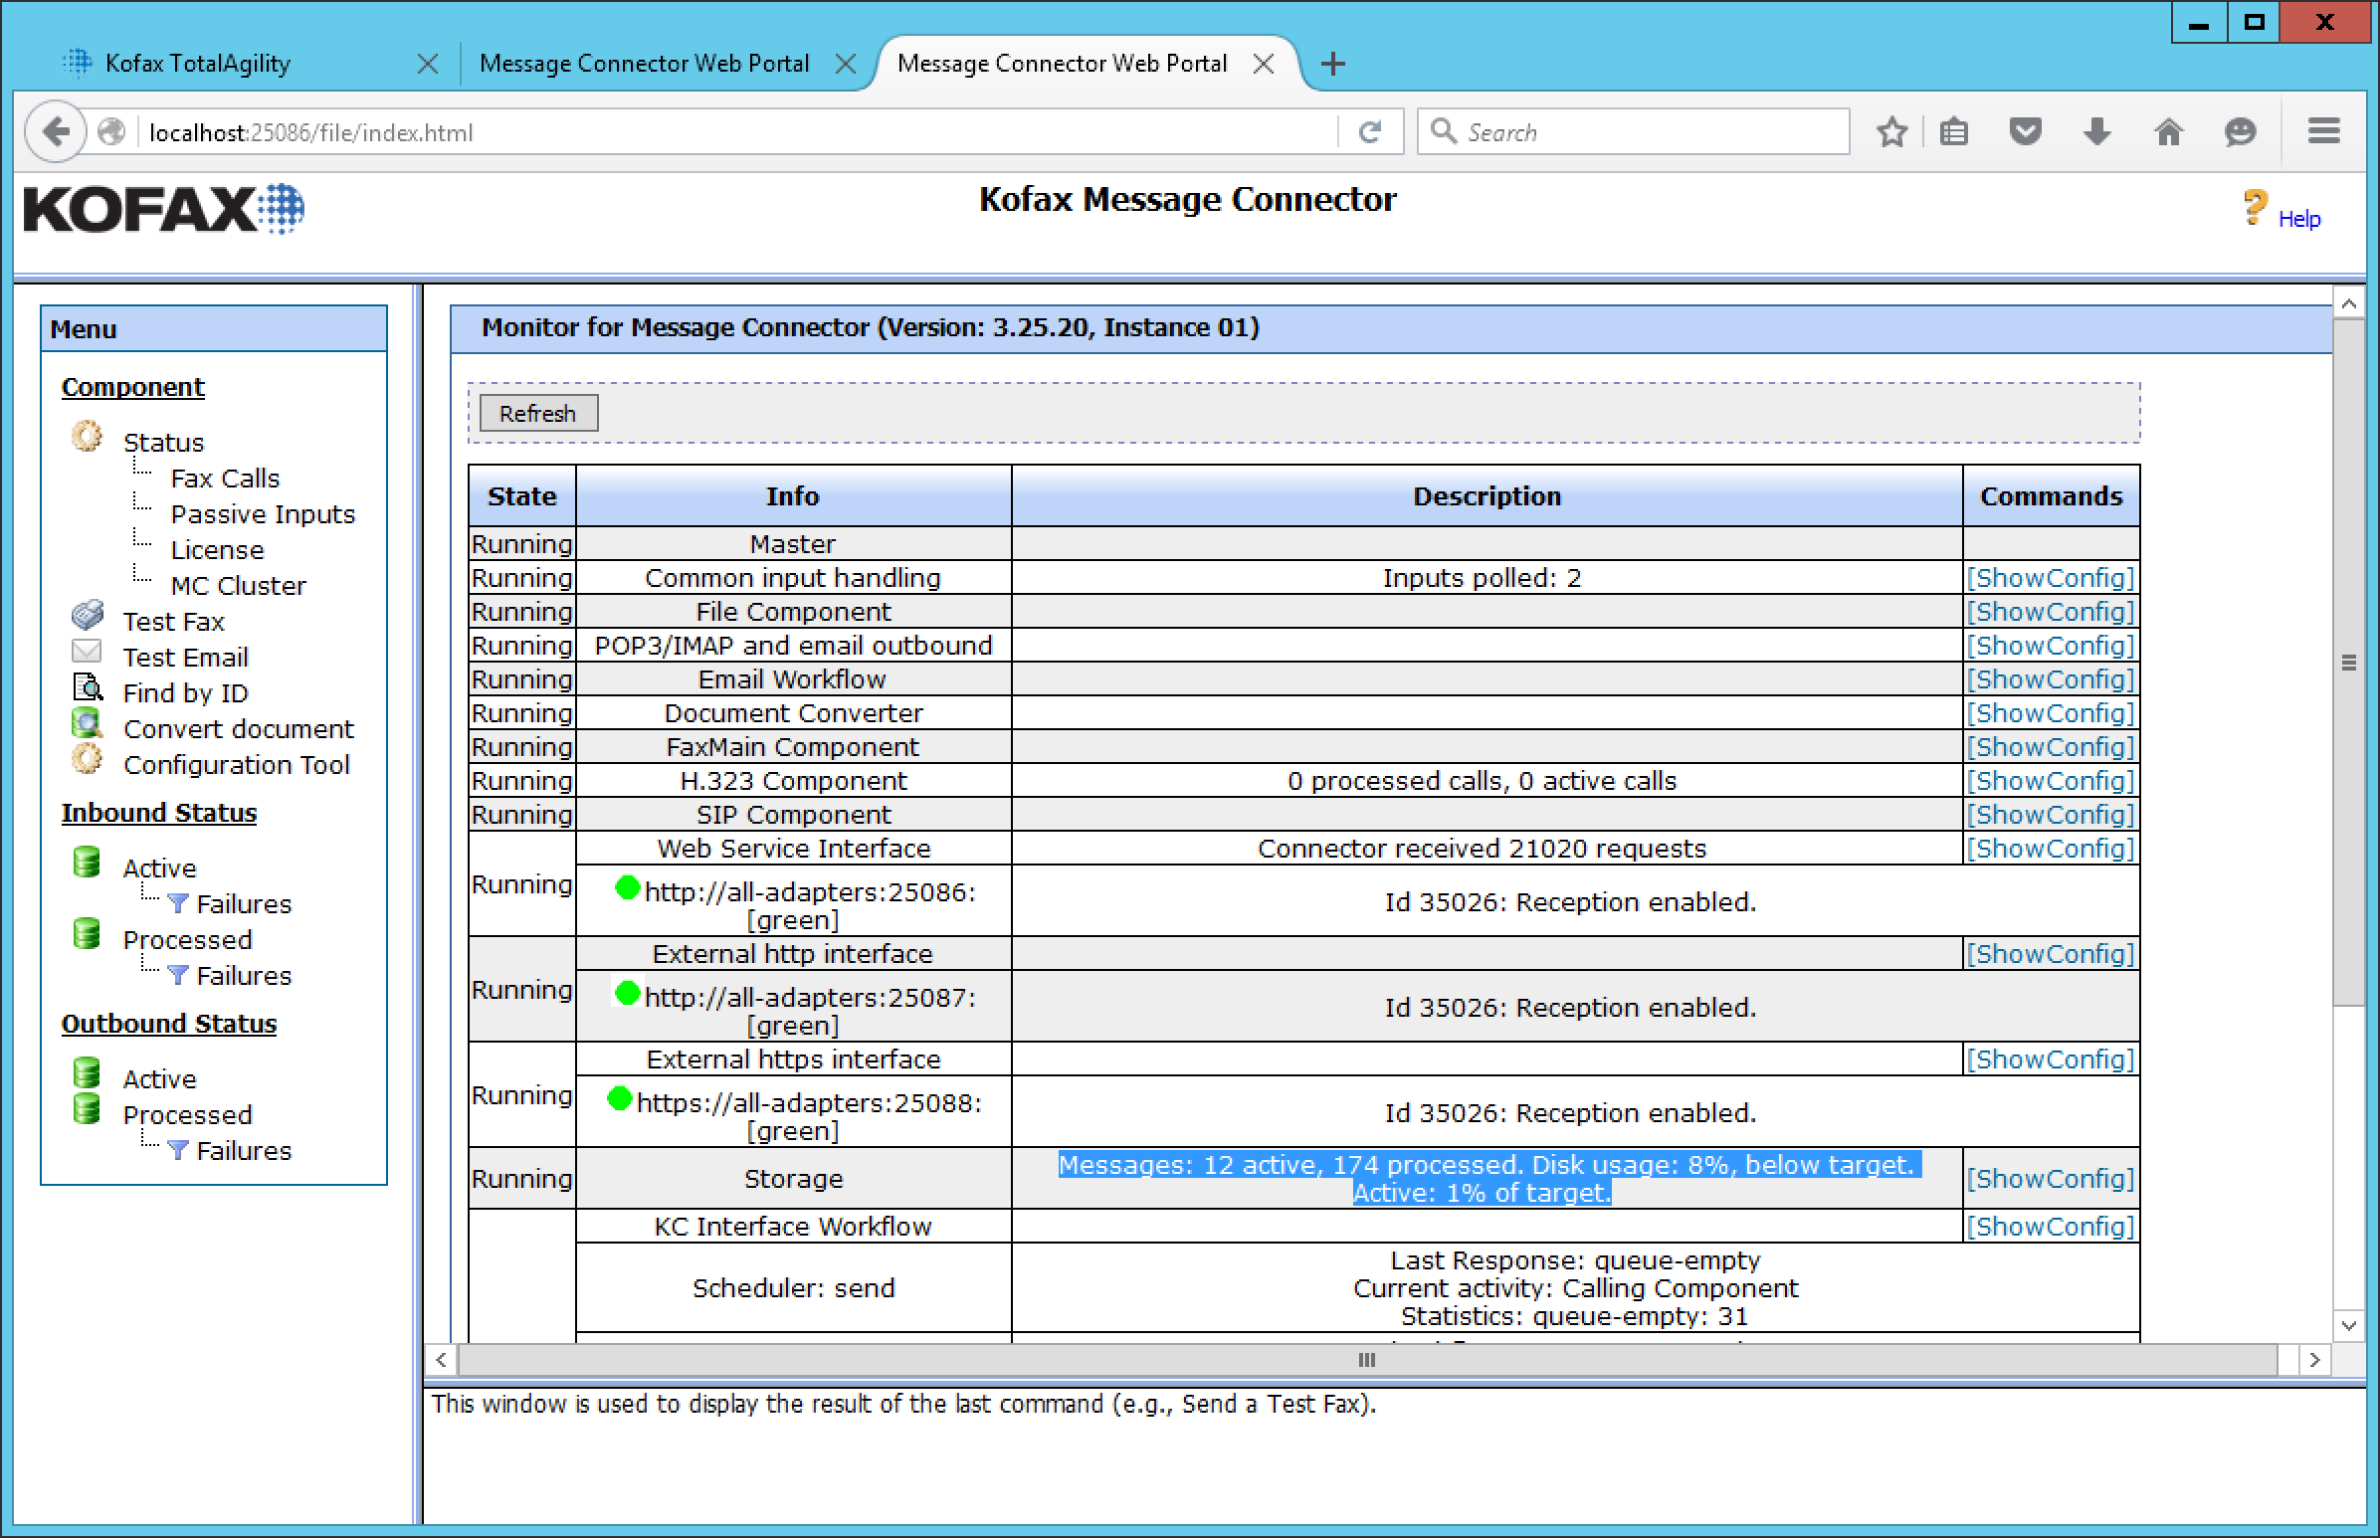
The ideal scenario: Kofax TotalAgility
So, why is it ideal when you’re already running KTA? Simple – we can cover it all: calling the web service every couple of minutes, evaluating the current state, serving alert emails. Even better: we can do all that without writing a single line of code! Here’s what I’m trying to achieve:
- When the storage reaches 90%, we want to alert the system administrator,
- when there are more than 10 messages queued, we want to alert a power user,
- we want the process to run automatically in the background once every 15 minutes.
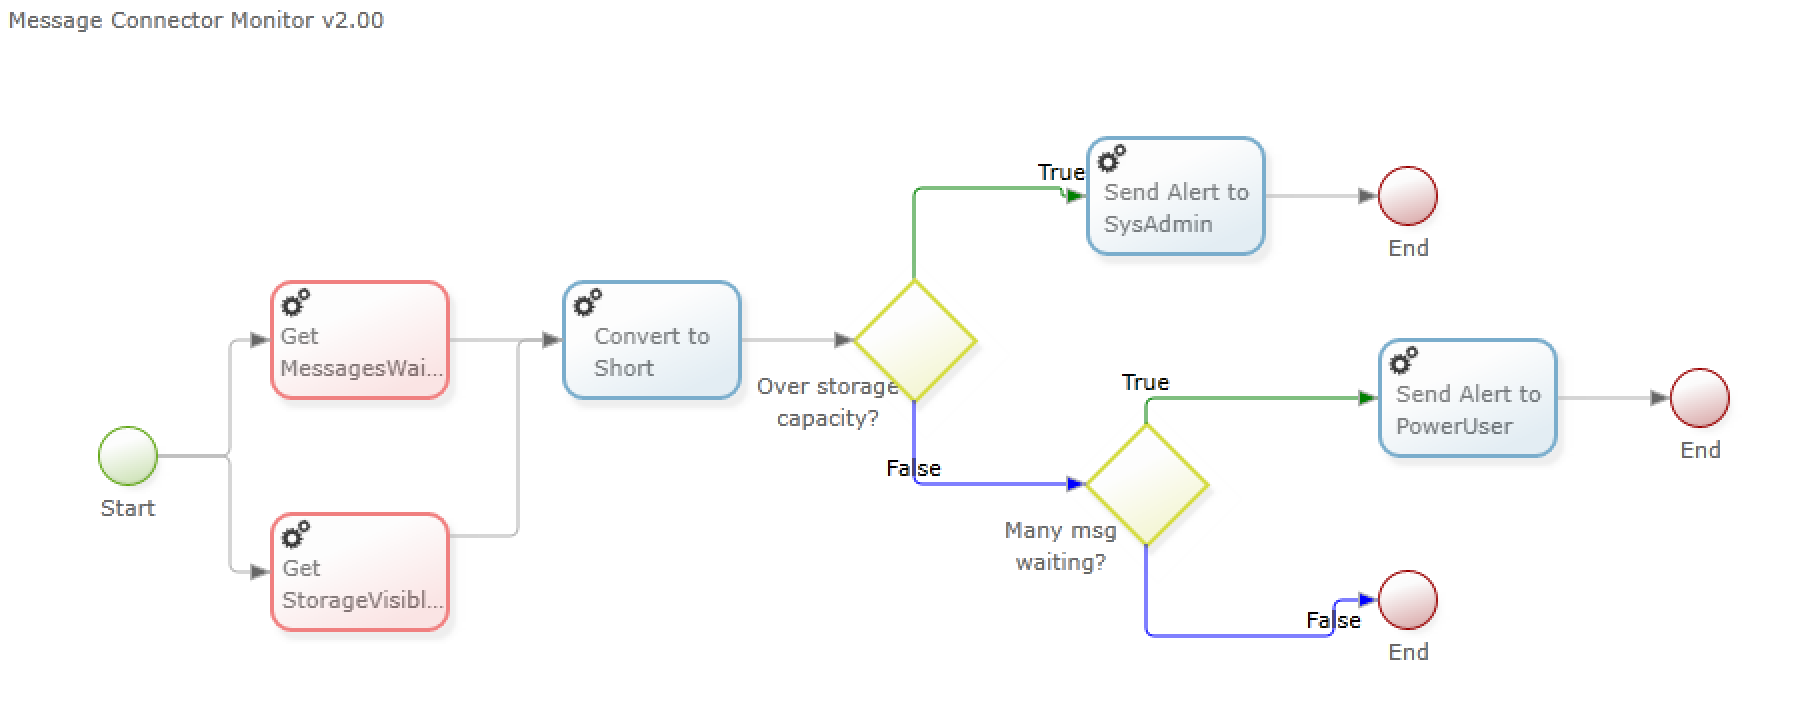
With the goals set, here’s the big picture of how we are going to tackle the requirements. At first, we shall call the web service to learn about the current amount of storage available and queued messages. Then, we need to do some conversion, evaluate whether any count has reached a critical limit – and in case send out an alert to a dedicated person (or group of persons). Sounds all to easy? Well, it is. Here’s how the final process looks:
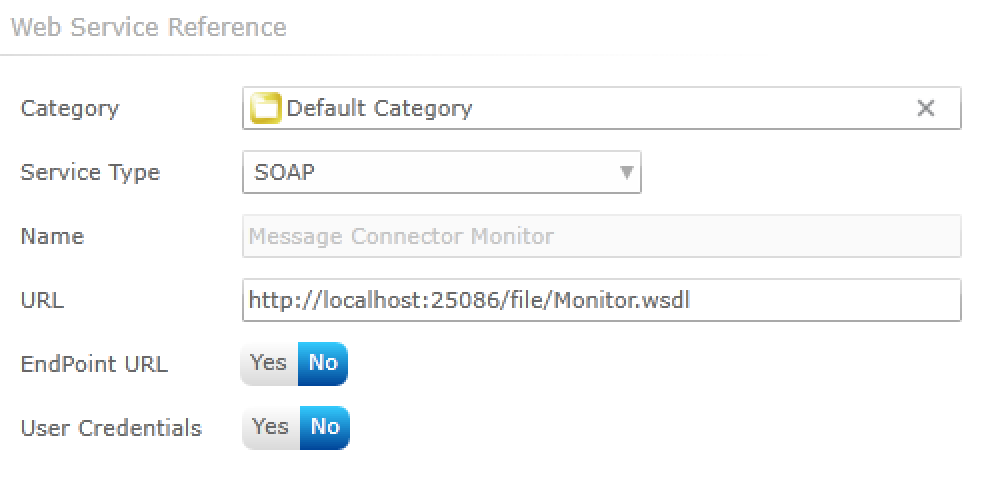
First thing is to make KTA aware of the web service we’re going to use. This can be done in the integration module, web service references – and the setup is quite easy, as well. All we have to do is to provide the URL mentioned earlier:
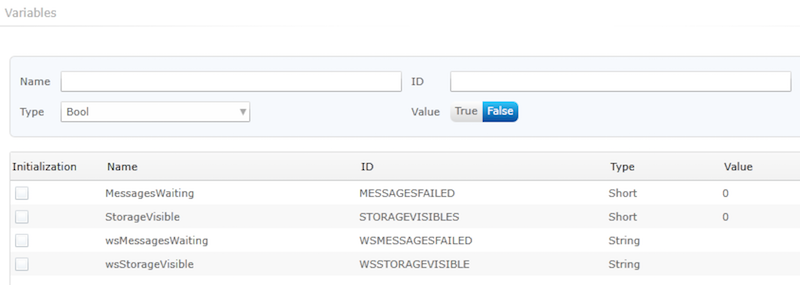
Then, we create a new process. I called it Message Connector Monitor, for the lack of a better name. The first two red activities will be executed in parallel: each one calls a different method of the web service, populating a string variable. So, here’s the first catch: the web service response always is a string. However, think of the following scenario: you want to send out an email when more than 10 messages are queued at the sane time – that requires a decision node, and decision node usually evaluate numeric values. Thanks to the useful expression activity however, we can easily convert the string from the web service into an integer – that’s why we need four variables. I decided to prefix the string variables with ws to differentiate between the web service response and the converted integer values.
Now that we have the numeric values for storage consumption and messages queued, it’s an easy task to evaluate each one within a decision node, sending out an email if the critical limits are reached. Note that in our process, if the first decision node is true, the second one won’t be evaluated. This means that if the storage already exceeds critical limits, we will notify the system administrator, but not the power user (even if the amount of max messages queued is reached). It’s quite easy to change that behaviour should need be. Below you will find the big picture with detailed information about every activity and the respective configuration – just click on it to display it in full size.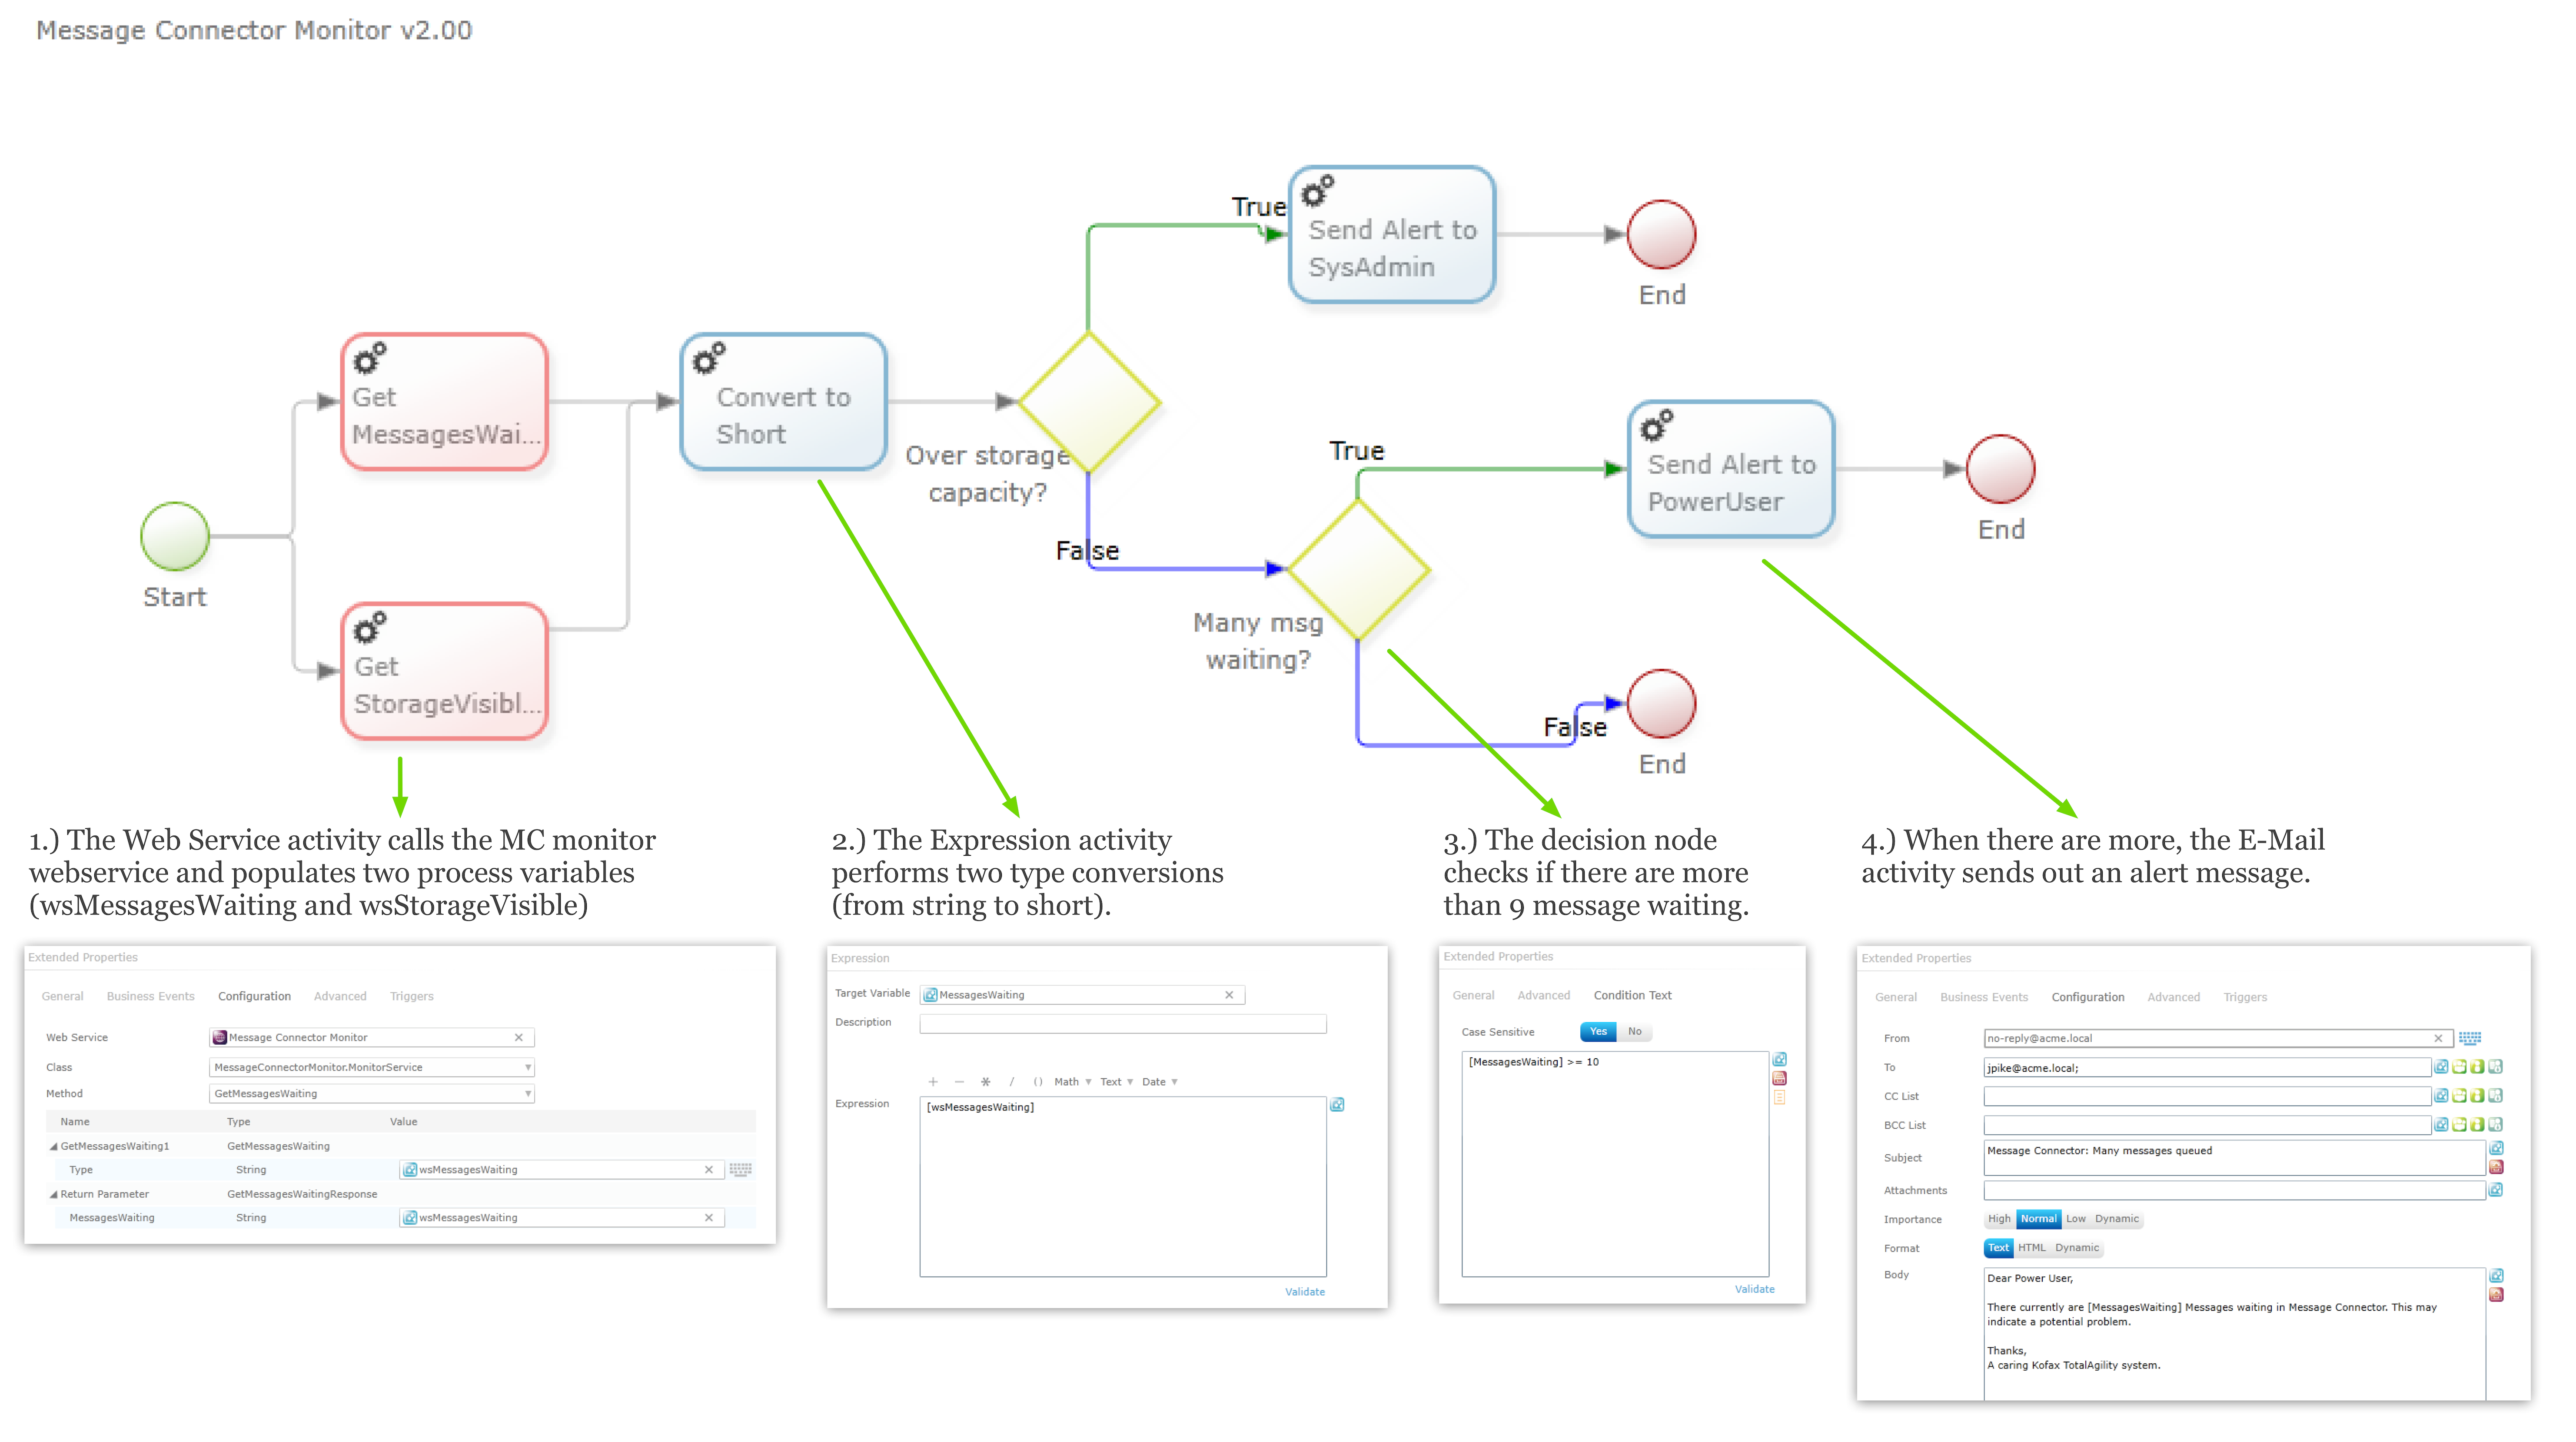
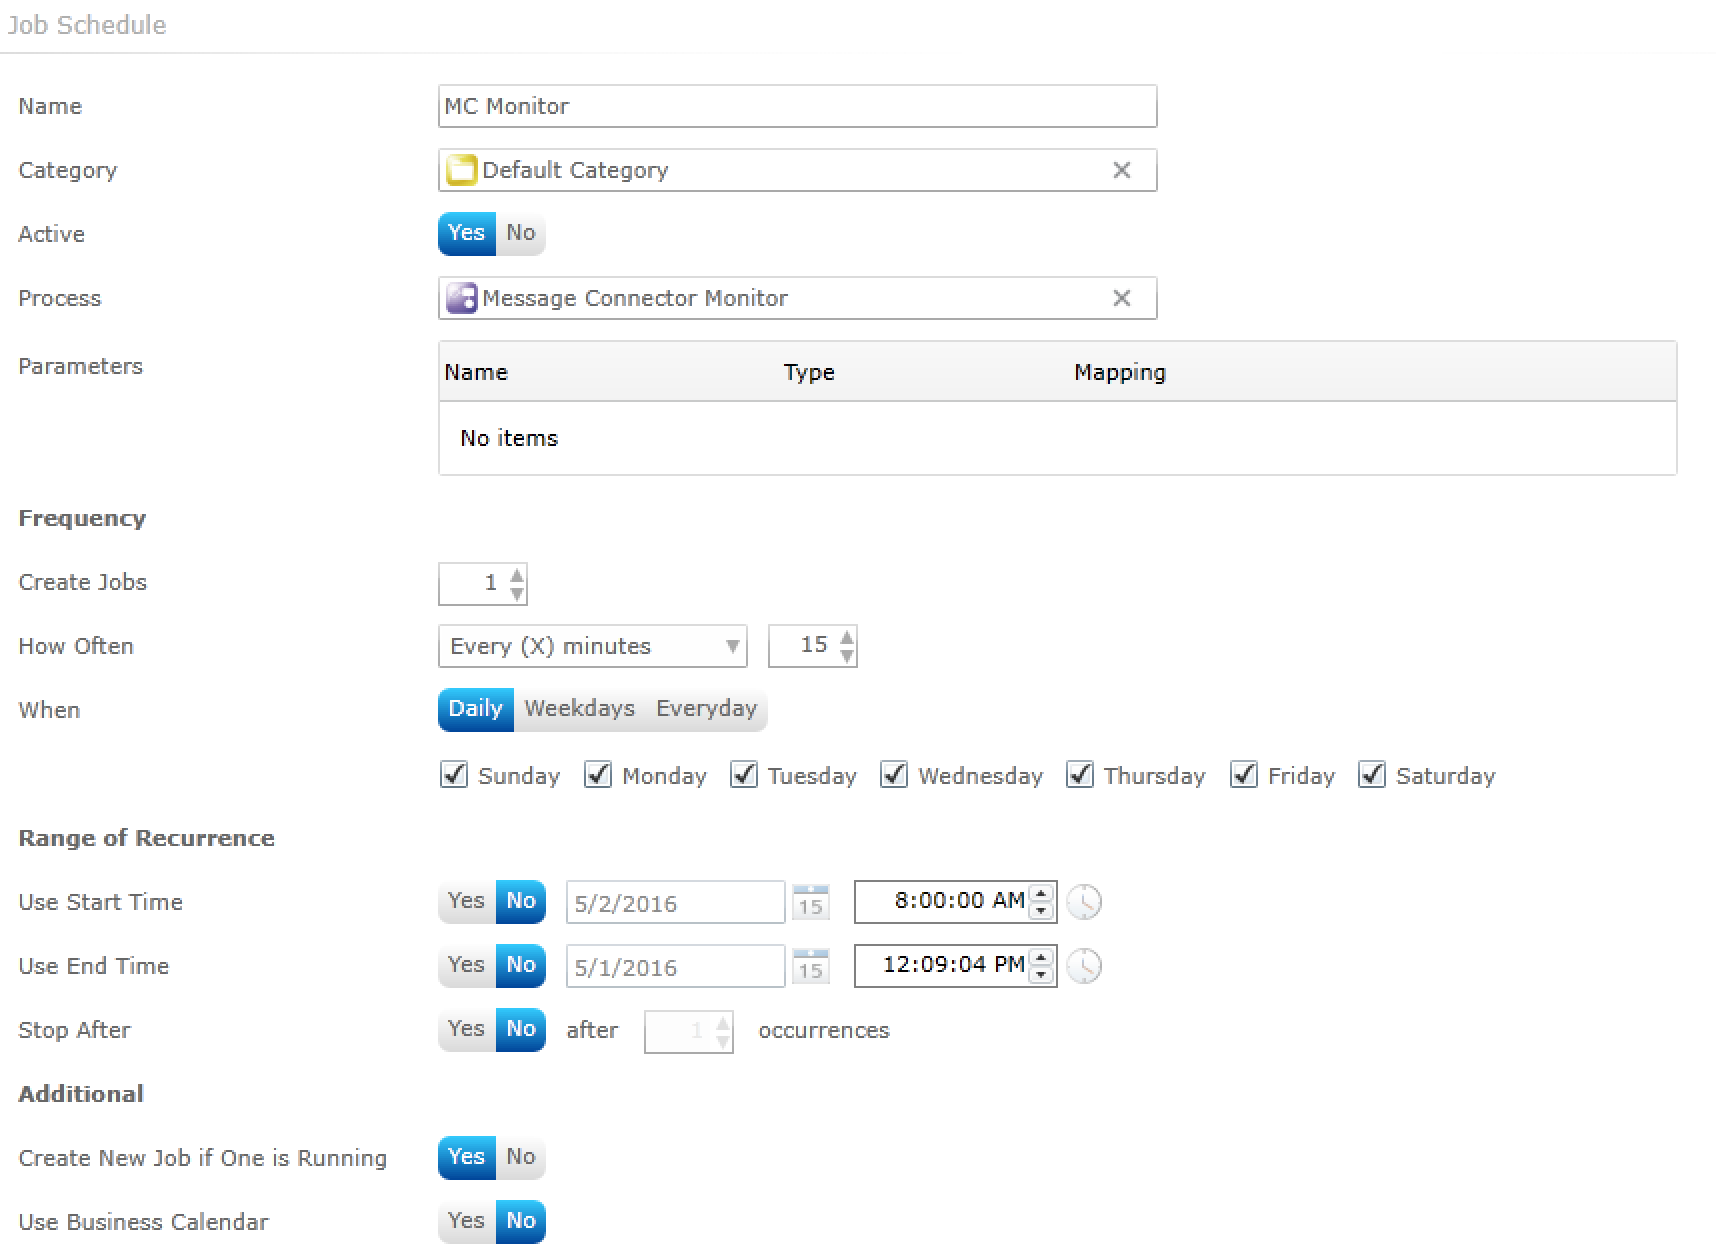
One thing is still missing: executing the business process automatically – we certainly don’t want to call it by hand. Here’s where job schedules will come into play: you’ll find the in the system settings. So, we just add a new schedule and configure it as follows – that’s it, now we will start receiving email alerts already!
Still using Kofax Capture?
If you’re on Kofax Capture, there is no out-of-the-box solution for monitoring the web service and sending out emails. However, you may want to write a small program in C# that does the job – alternatively, you can use another monitoring solution already present in your organisation (the preferable choice, of course).
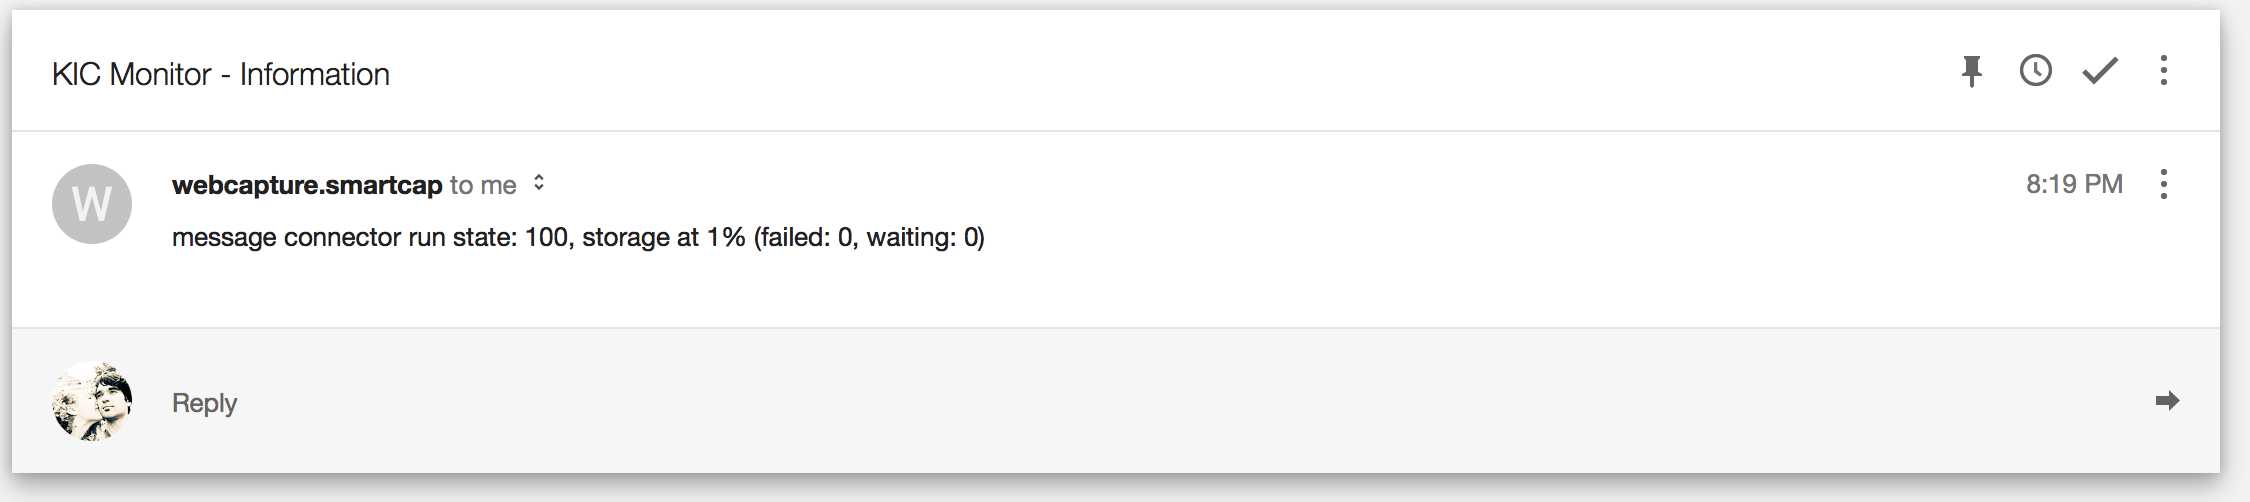
Below sample shows a quick-and-dirty approach with C# – a small console program running in the background, calling the web service, eventually sending out alerts via SMTP. Don’t forget to add a service reference pointing to the wsdl:
using System;
using KicMonitor.MonitorService;
using System.Net.Mail;
using System.Net;

namespace KicMonitor
{
    class Program
    {
        static void Main(string[] args)
        {
            string runState, storageVisible, messagesFailed, messagesWaiting;
            string info;
            byte[] credentials = new byte[0];
            // fetching data from the MC monitor web service
            MonitorPortTypeClient ws = new MonitorPortTypeClient();
            runState = ws.GetRunState(credentials, "").RunState;
            storageVisible = ws.GetStorageVisible(credentials, "").StorageVisible;
            messagesFailed = ws.GetMessagesFailed(credentials, "").MessagesFailed;
            messagesWaiting = ws.GetMessagesWaiting(credentials, new GetMessagesWaiting()).MessagesWaiting;
            info = string.Format("message connector run state: {0}, storage at {3}% (failed: {1}, waiting: {2})", runState, messagesFailed, messagesWaiting, storageVisible);

            // relaying an email via gmail smtp
            string smtpHost, user, password, sendTo;
            smtpHost = "smtp.gmail.com";
            user = "your-user@gmail.com";
            password = "your-password";
            sendTo = "anyone@mail.local";
            SmtpClient client = new SmtpClient(smtpHost, 587)
            {
                Credentials = new NetworkCredential(user, password),
                EnableSsl = true
            };
            client.Send(user, sendTo, "KIC Monitor - Information", info);
            Console.WriteLine(info);
            Console.ReadKey();
        }
    }
}
Conclusion
Regardless if you’re using KTA or KC, the Message Connector exposes all data required for monitoring its current state via a simple web service interface. Using said interface will allow you to prevent issues related to storage in the first place without anyone actively monitoring the MC every once in a while – that saves a significant amount of time each day, every day – and guarantees that erroneous messages won’t be forgotten when you fail to check for them actively. Moreover, I was quite impressed that I was able to create a monitoring and alerting process in KTA without writing a single line of code.